Fvtool for Octave
See file fvtool_for_octave.zip for fvtool.m script.
Source code
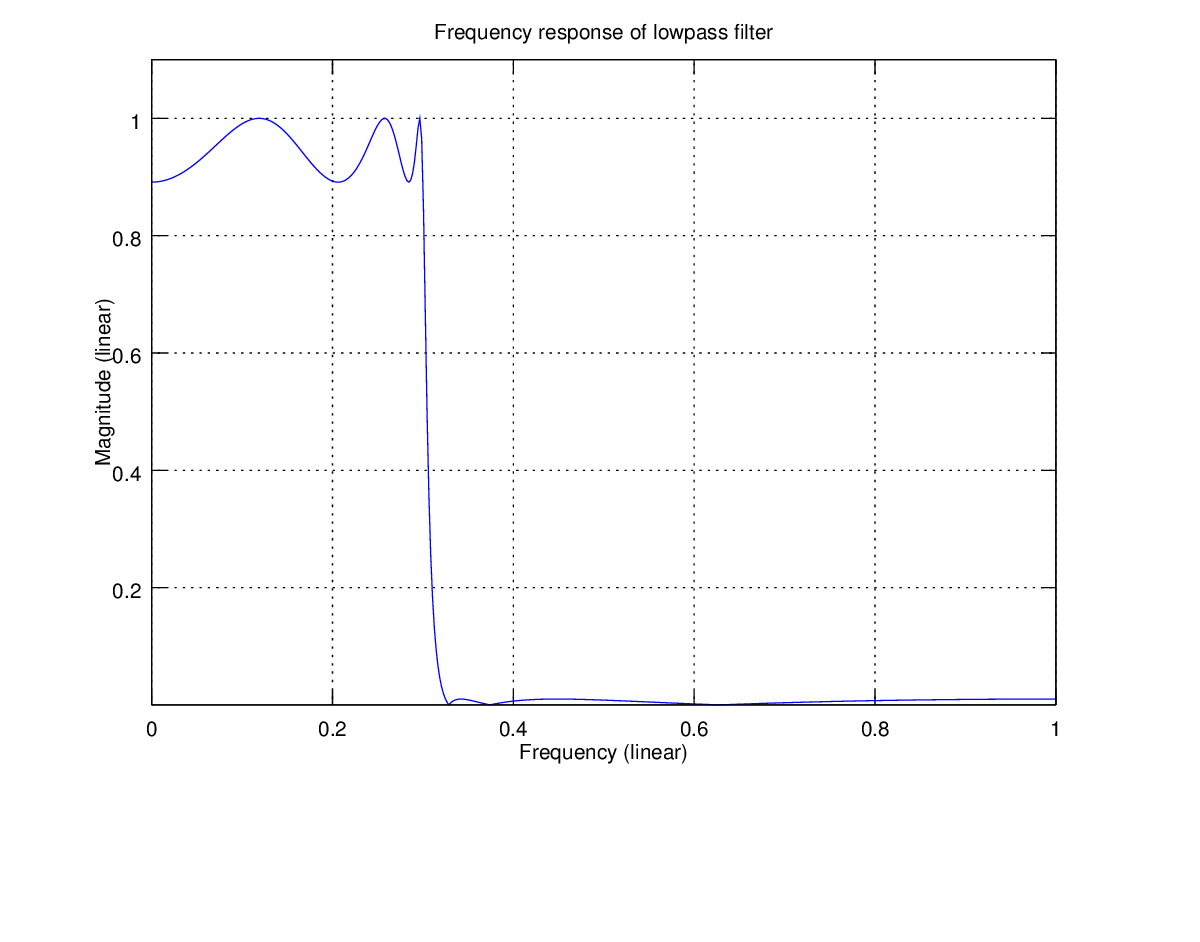
%% lets make lowpass filter (6th order, elliptic type)
%[num,den]=butter(6,0.3);
[num,den]=ellip(6,1,40,0.3);
figure(1)
fvtool(num,den);
title('Frequency response of lowpass filter')
% Note: default axes are linear frequency and gain in times
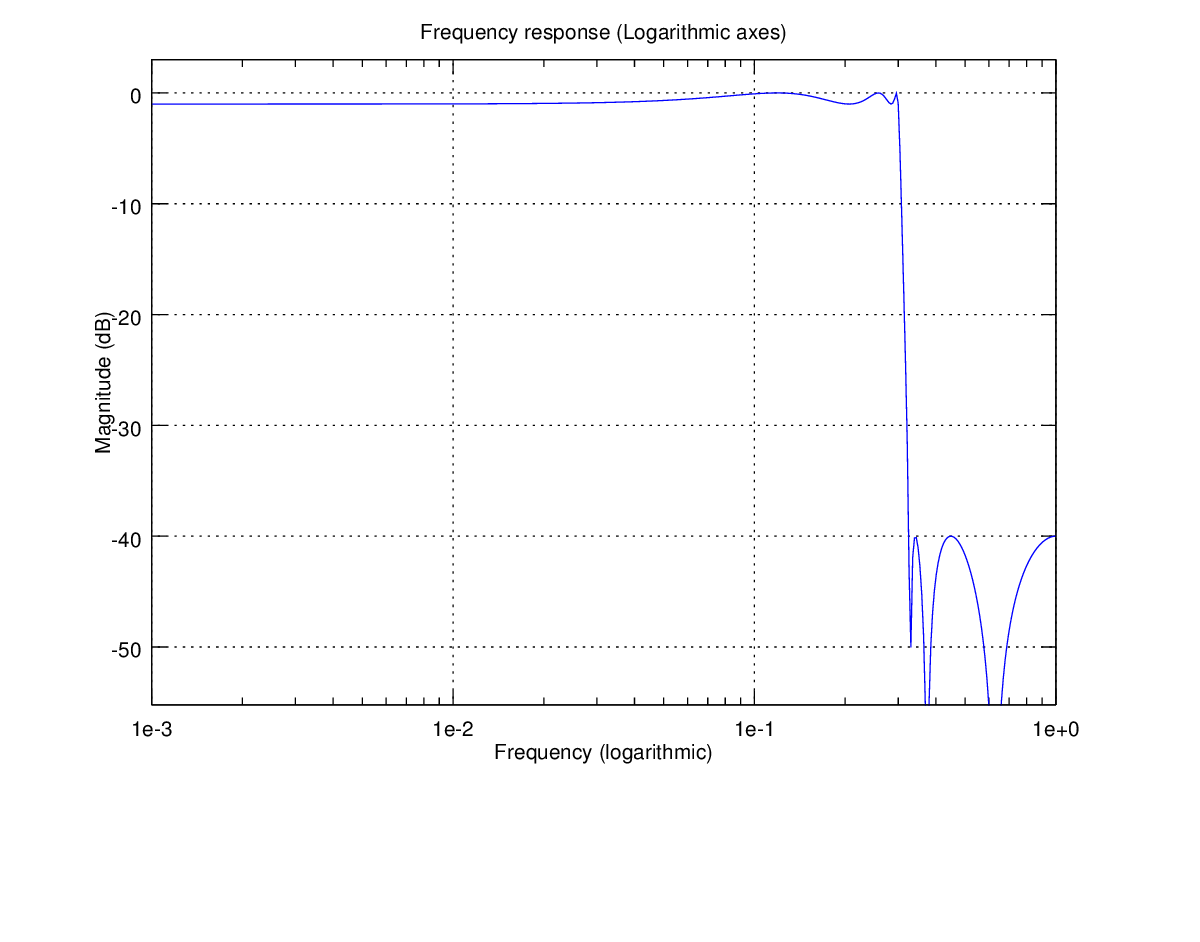
%% you may switch axis mode to dB and logarithmic frequency
figure(2)
fvtool(num,den,'MagScale','Logarithmic','FreqScale','Logarithmic');
title('Frequency response (Logarithmic axes)')
% Note: you may use shortenings like ...'Mag', 'Log', 'Freq', 'Log'...
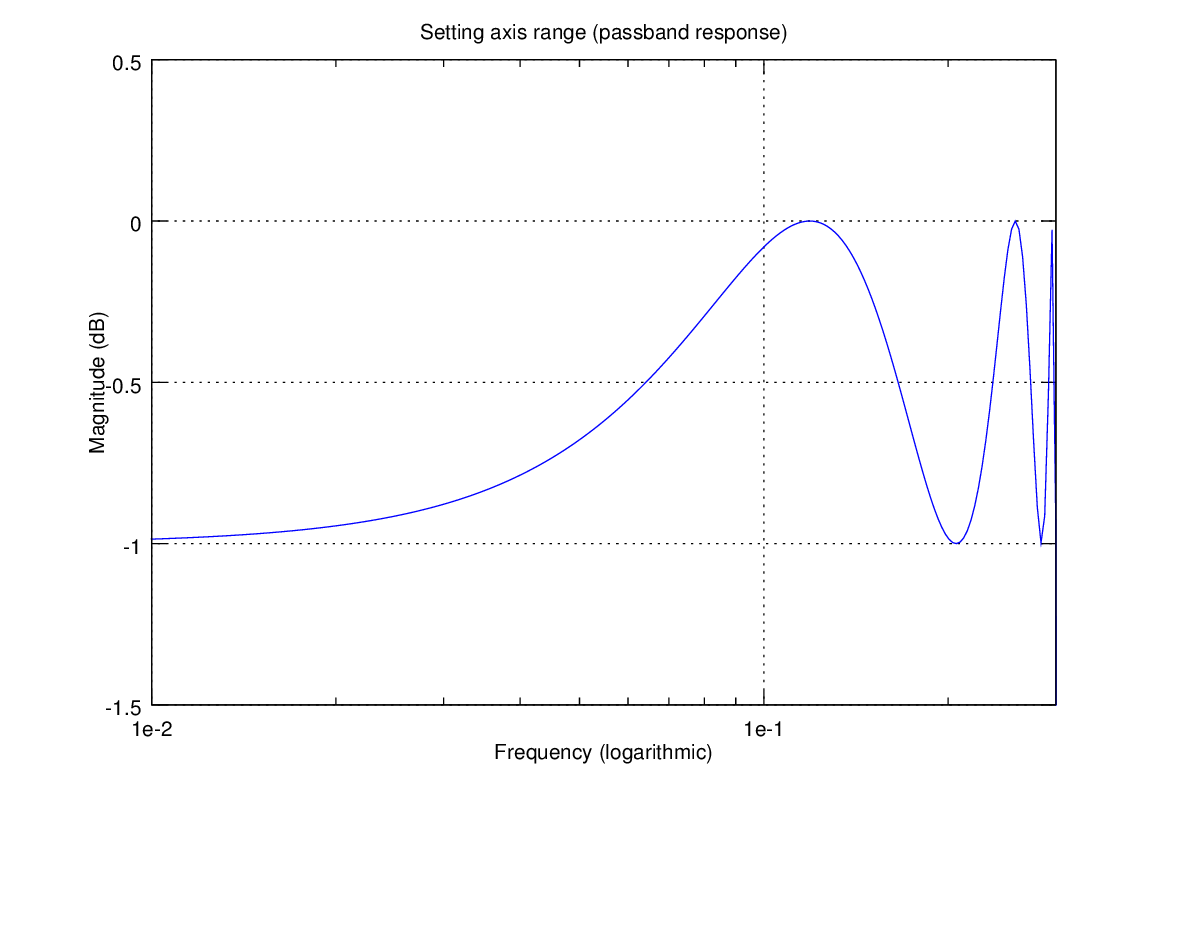
%% you may also set ranges for both axes
% lets zoom to pass band frequency response
figure(3)
fvtool(num,den,'AxisX',[0.01 0.3],'AxisY',[-1.5 0.5],'MagScale','Logarithmic','FreqScale','Logarithmic');
title('Setting axis range (passband response)')
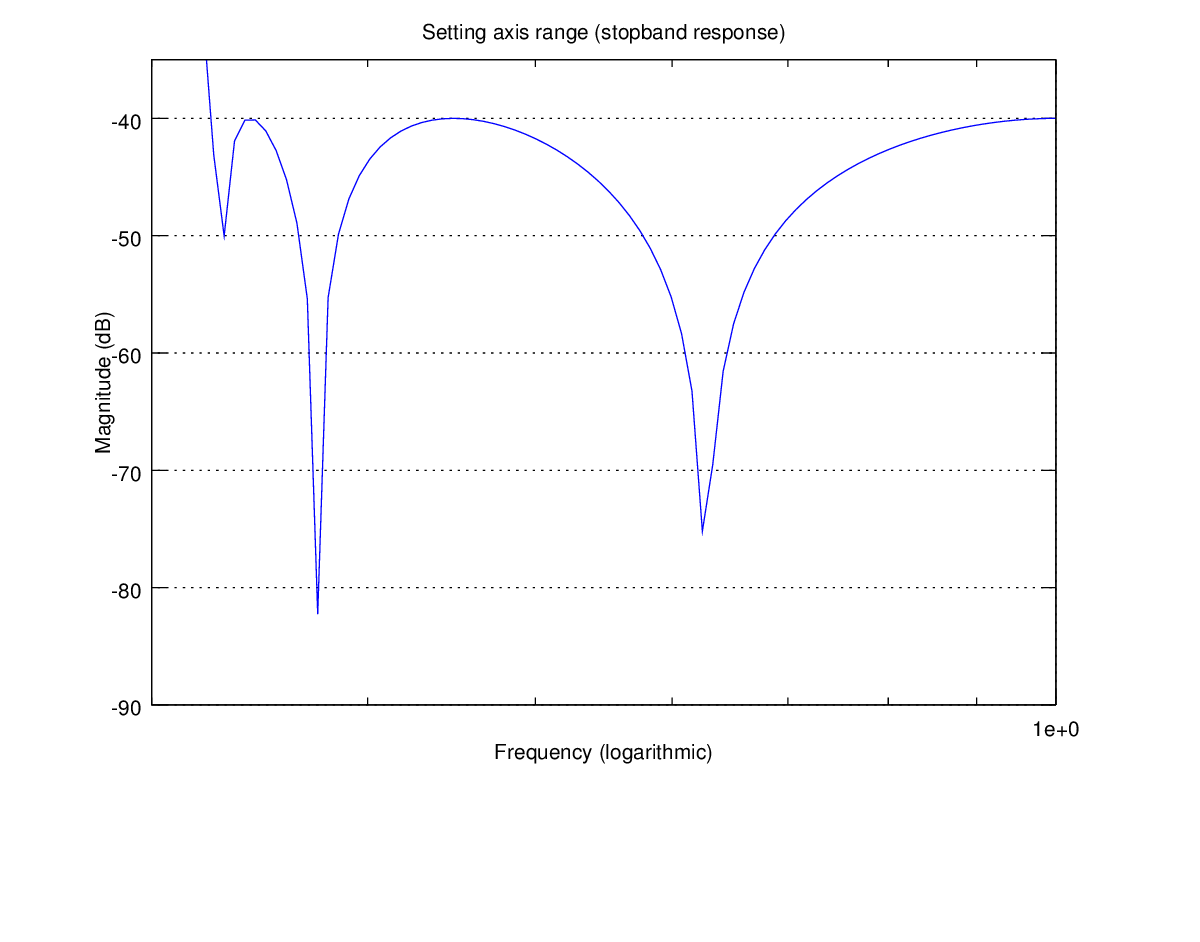
%% and more
% lets zoom to stop band frequency response
figure(4)
fvtool(num,den,'AxisX',[0.3 1],'AxisY',[-90 -35],'MagScale','Logarithmic','FreqScale','Logarithmic');
title('Setting axis range (stopband response)')
%% you may display different responses
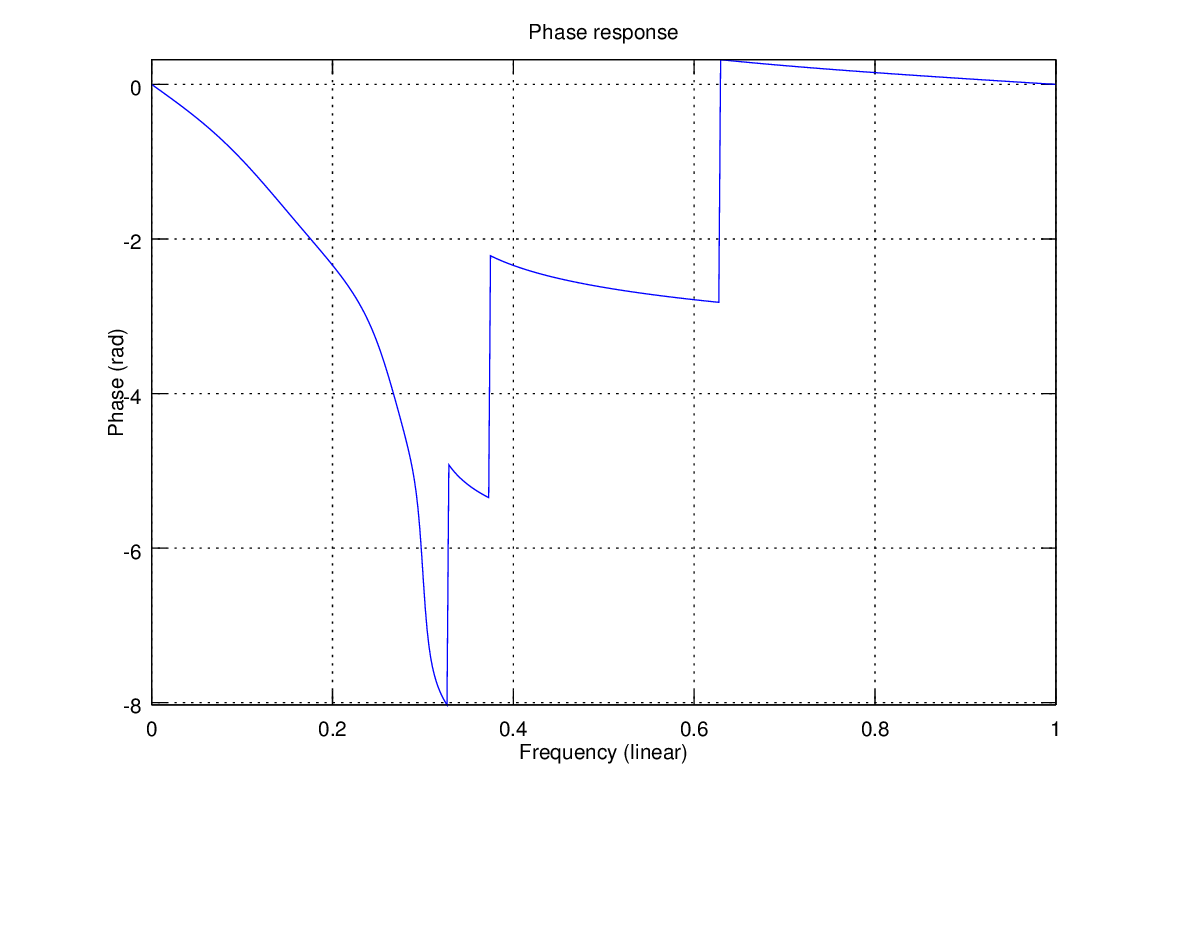
% such as phase response
figure(5)
fvtool(num,den,'Display','Phase');
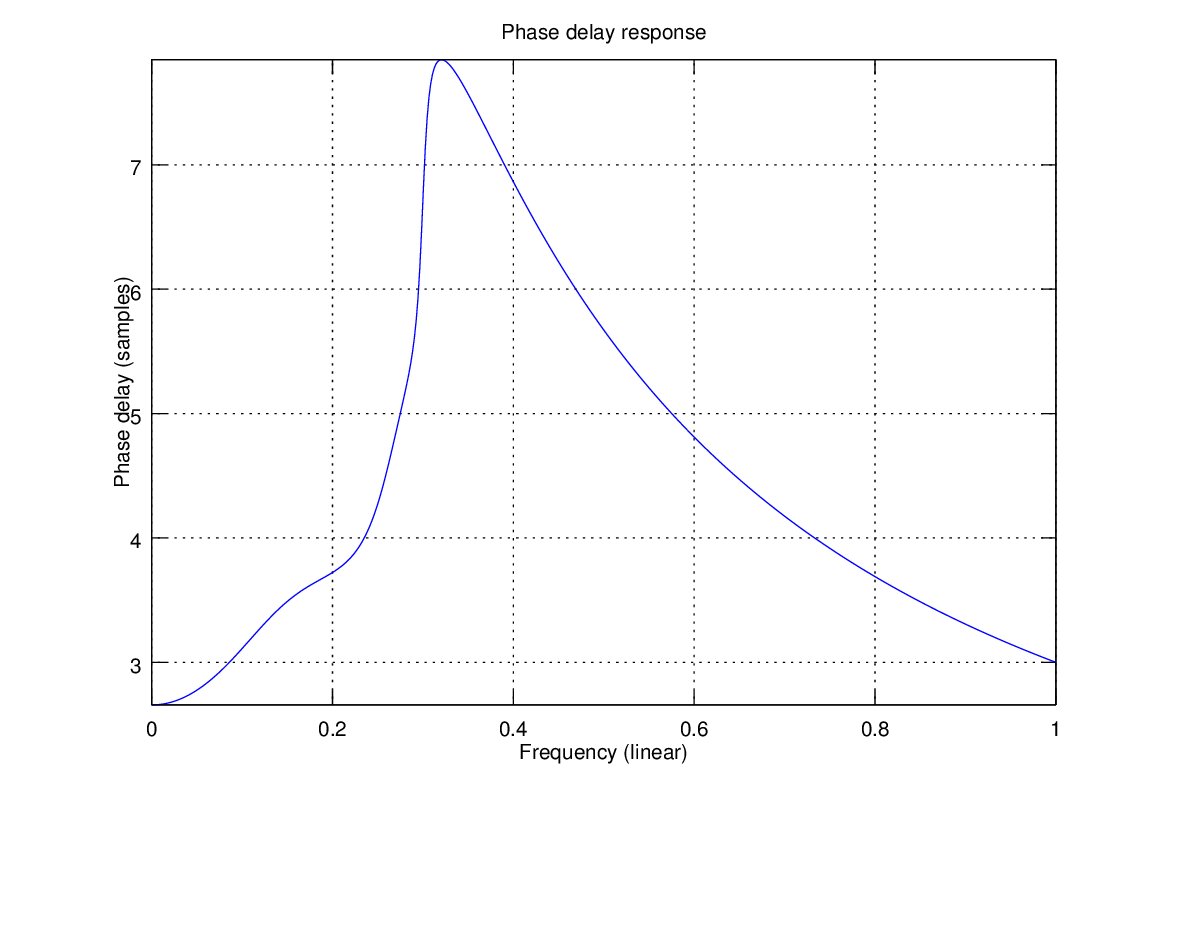
% or phase delay response
figure(6)
fvtool(num,den,'Display','PhaseDelay');
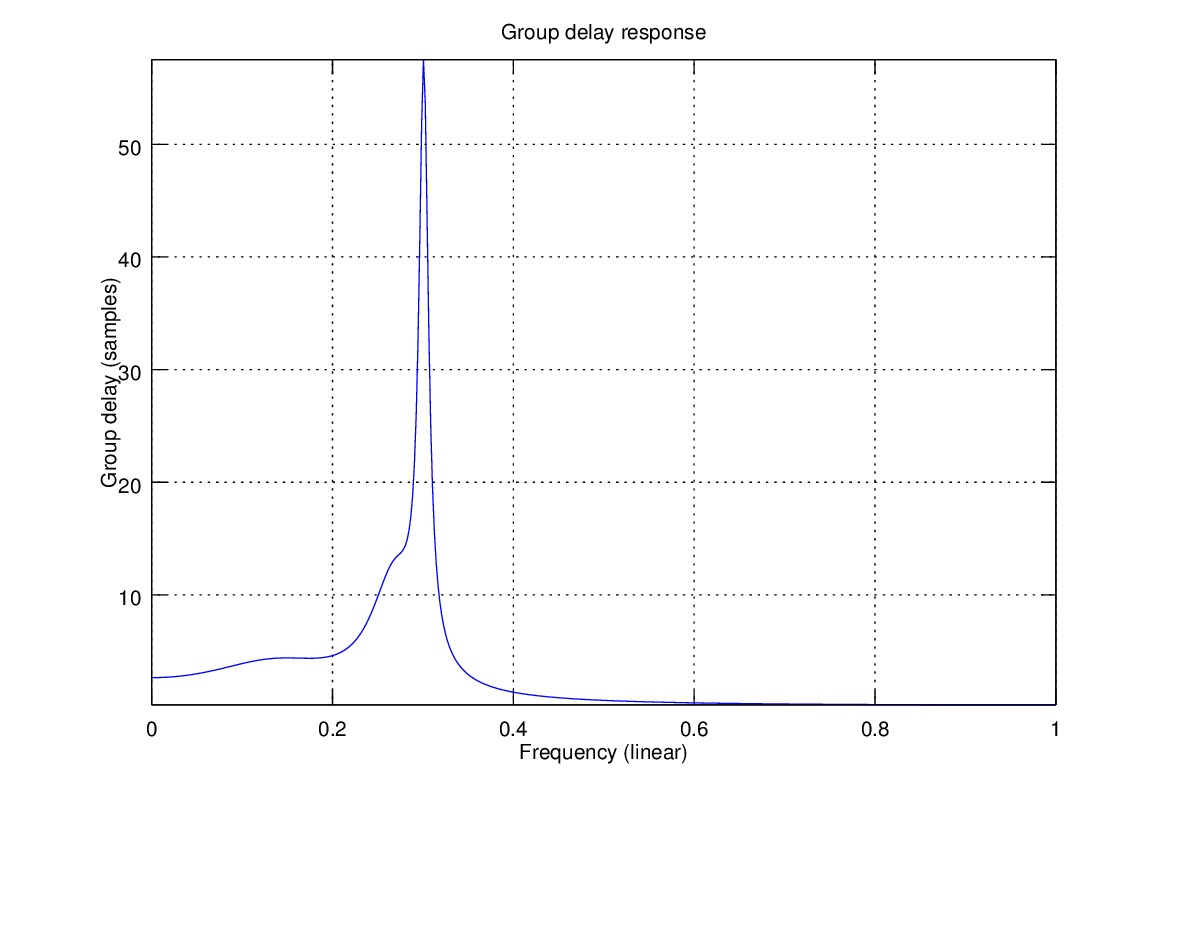
% or group delay response
figure(7)
fvtool(num,den,'Display','GroupDelay');
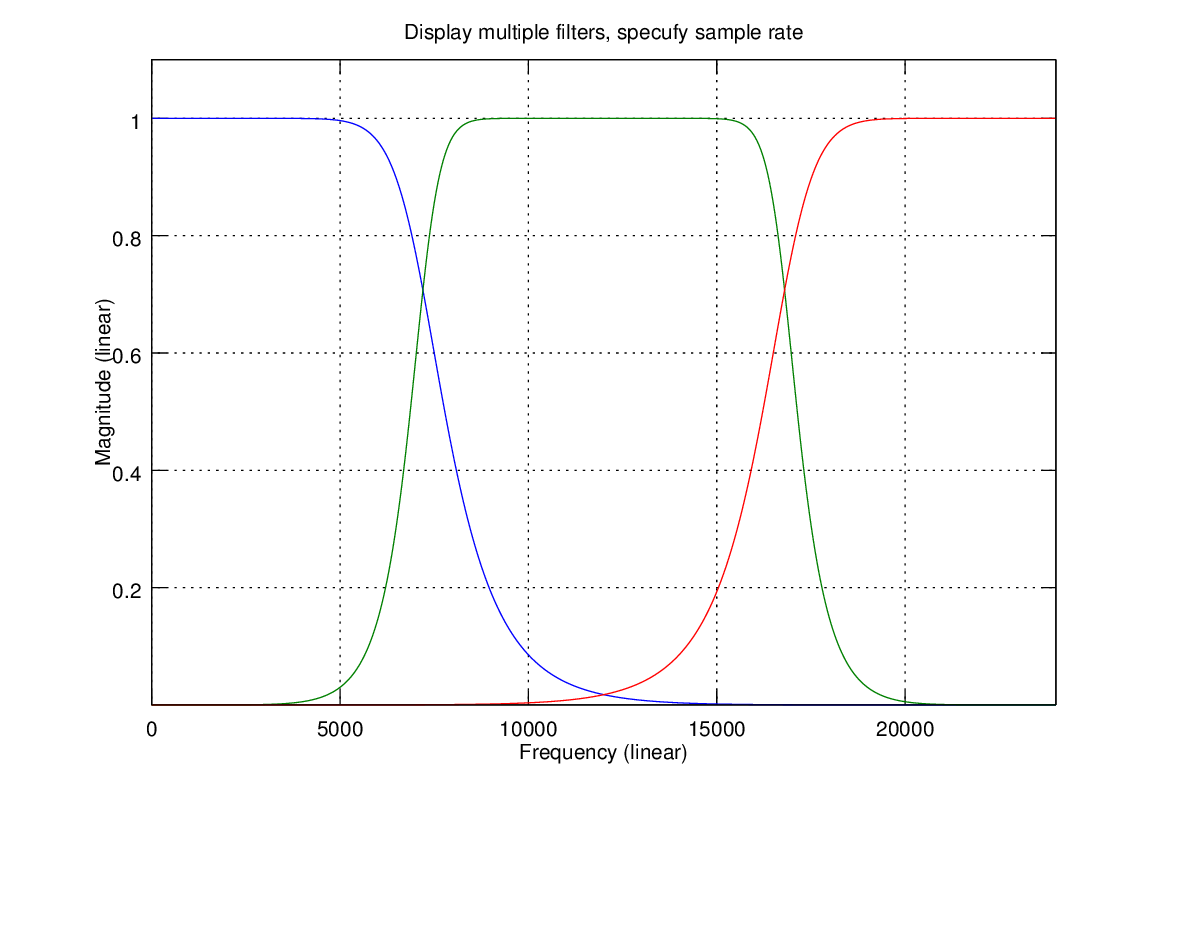
%% display multiple filter response and specifying samplerate is possible
[num0,den0]=butter(6,0.3);
[num1,den1]=butter(6,[0.3 0.7]);
[num2,den2]=butter(6,0.7,'high');
figure(8)
fvtool(num0,den0,num1,den1,num2,den2,'Fs',48000);
title('Display multiple filters, specufy sample rate')
Execution results
octave>bqfilt
Generated graphics